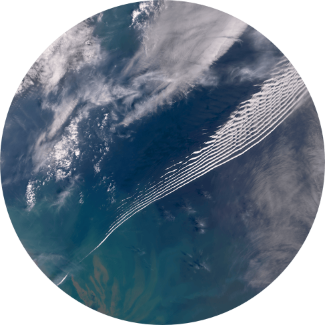
Interaction of atmosphere and biosphere
To build a novel index describing the state of the atmosphere and biosphere and their interaction, we will build on data-driven approaches as described in (Kraemer et al 2020a and 2020b). To advance this work, we want to combine these data-driven approaches with domain knowledge as described in (Reichstein 2019) to work towards methods that perform physics-Informed dimensionality reduction. In a first iteration we plan to enhance traditional autoencoders or variational autoencoders by adding additional loss terms that control the behaviour of the hidden state of the encoder. A showcase that this is possible has been recently published by Varando et al. (2021). This way we will produce an ecosystem and atmospheric state indicator that is interpretable in its meaning and direction.
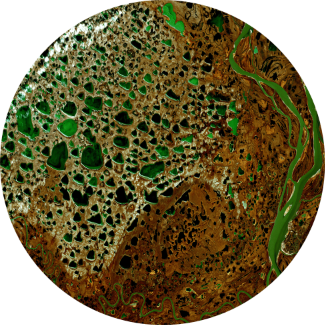
Extremes in the Terrestrial Biosphere
Earth system processes in the biosphere can be represented by few dimensions, the resulting dimensions can be used to detect multivariate extremes (Kraemer et al., 2020). Such approaches can be exploited to identify extreme event but are not given any mechanistic insights to the event dynamics and are, in particular, not revealing more complex event dynamics. For instance, the question on how to detect cascading events (see SoW) requires considering temporal dynamics that characterize cascading events including their memory effects. The rationale is that typically such compound and temporal cascading event will have a very strong influence on the impact of the extreme on society and ecosystems. “Sequence to sequence models” (Zaytar & Amrani, 2016, Lample & Charton, 2019) have been used successfully for many applications such as machine translation, voice conversion, chat bots, symbolic integration of differential equations and other tasks but their potential for the detection of multi-hazards and cascading events in the biosphere has not been explored yet. Here we plan to use sequence to sequence models to characterize extremes and juxtapose simple extremes, multi-hazards and compound extremes in order get a better understanding of their impacts to society and ecosystems. Reference data are societal impact data that have been pre-processed in ESDL and other projects.
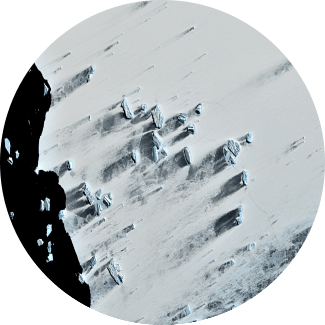
Dynamics in Polar Regions
First, a dedicated data cube will be generated, it is envisaged that it will contain mainly Copernicus imagery acquired by Sentinel-1 and Sentinel-2 but also additional markers of ice damage such as strain rate derived from ice velocities and output of numerical simulation if available at the time of the project. The case study will first focus on the Amundsen Sea Sector of the Antarctic Ice Sheet, where significant changes have taken place over the years covered by Sentinel’s acquisition, which makes the area both relevant and suited for change detection. The neural network will then be setup, we envisage using a U-Net implementation, and applied to the data cube which will result in the first ever high-resolution time series of ice damage. The outcome of the study will be binary maps of damage area and of its change through time. This product will be made available to the community of ice sheet scientists and can be expanded in the future to include the entire ice sheet as well as to other input datasets both from observation and numerical simulations.
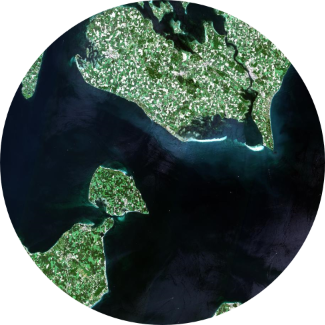
Carbon Cycle in the Baltic Sea
The main scientific question of the Ocean Science use case will be to identify causes for the changes in the Baltic Sea carbon cycle. As basis for answering this question, data will be harmonised in a Baltic Data cube and explored with explainable AI methods. The main input data sources for this application will be the model output from the ERGOM model, which is a nice showcase and required here, as not all variables are observable with EO. In particular, we will focus on solving nonlinear prediction problem between potential drivers (river discharge, environmental conditions), and observable responses (EO data), to predict complex biogeochemical processes that can only be obtained from the model. The rationale is that if it could be demonstrated that such a complex prediction problem could be solved with deep learning methods, and additionally, the interpretability (XAI) of the prediction is given, it would be thinkable to emulate the model in near real time. As a consequence, the input data from e.g., rivers, climate and EO could be used to likewise provide first estimates on the biogeochemical process under scrutiny.
Images contain modified Copernicus Service information [2022].