An extensive data offer with a large number of data variables is a major paradigm of ESDL. Such information richness, however, is hard to oversee, particularly as the data sets cover different periods. Fortunately, we have developed an intuitive yet powerful viewer for ESDL that facilitiates an explorative approach to ESDL. It offer all metadata, allows for browsing through the Earth System Data Cube variable by variable and image slice by image slice.
A particular strength of the viewer is the time-series functionality. Users may display time-series for arbitrary points but also arbitrary shaped regions, in which case the time-series will be calculated on-the-fly and displayes as mean with error bars indicating the standard deviation at each time step. This functionality is possible, because different to many other viewers, the ESDL viewer directly works on the data rather than with pre-computed images. The main features of the ESDL viewer are described in the fiugre below but you may also turn to the xcube viewer documentation for more information or contact us directly!
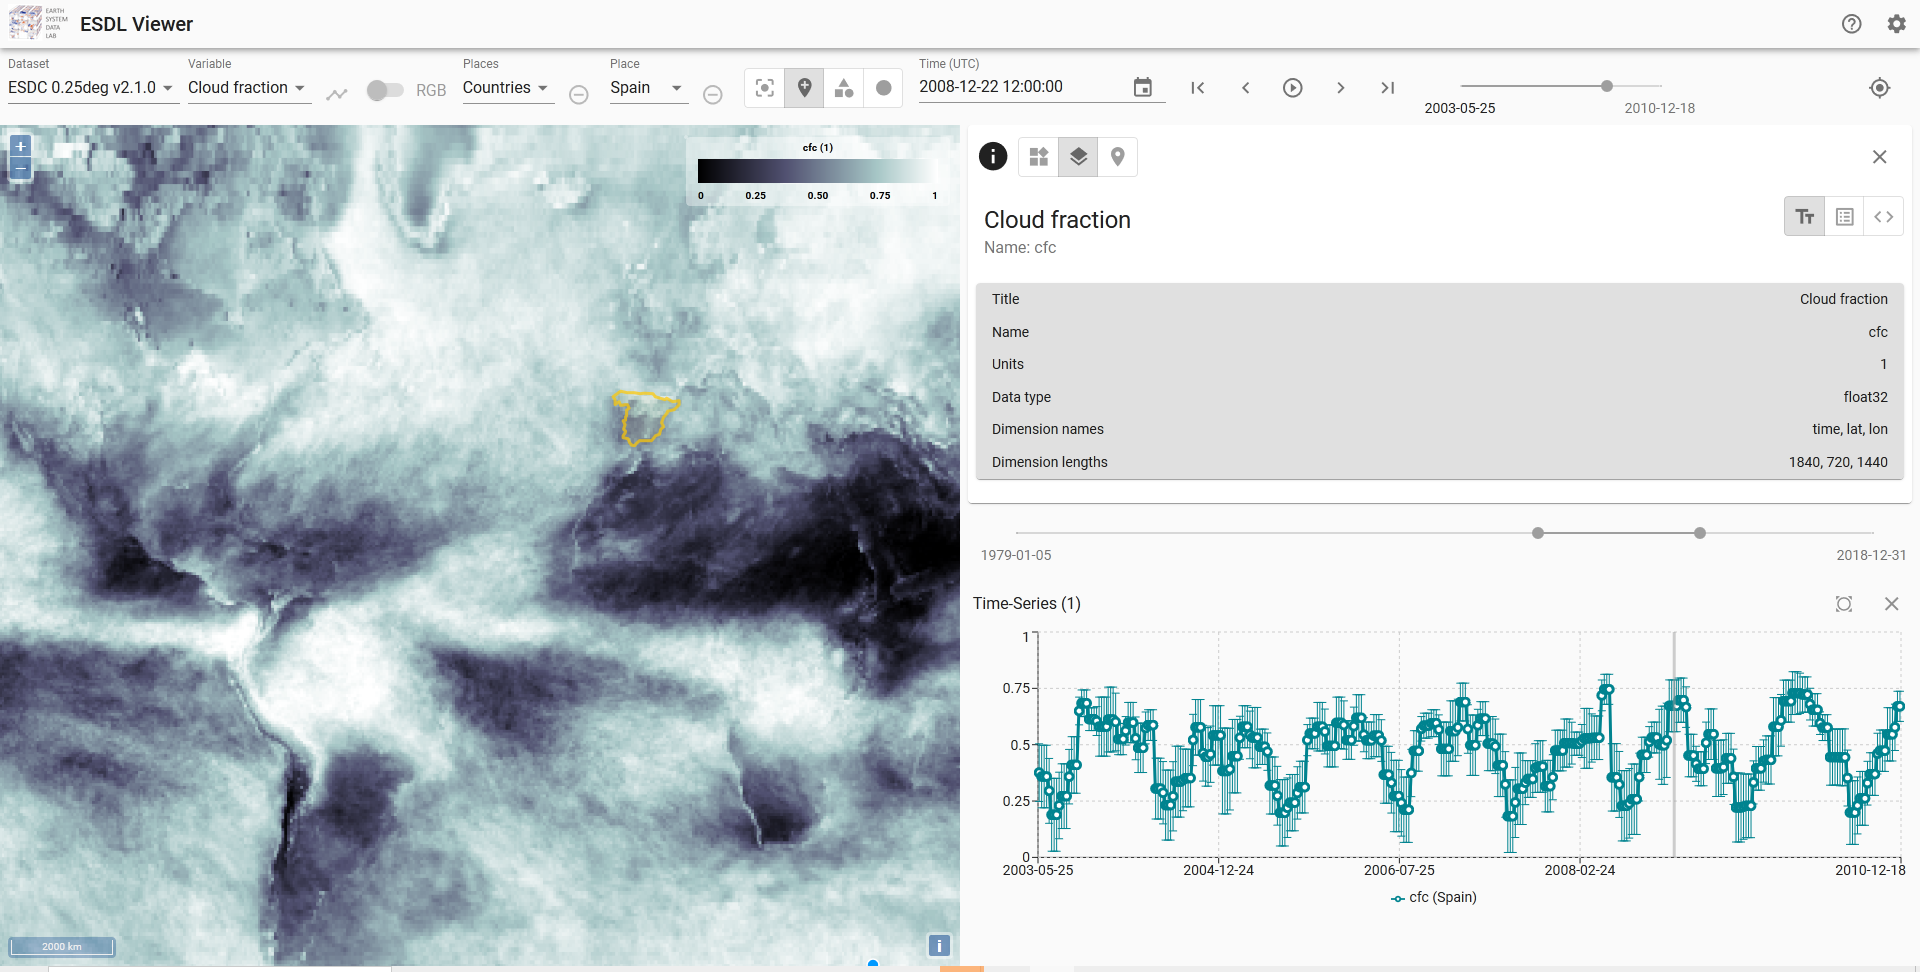
Image Panel – Images of data variables are displayed here. Zoom seamlessly from from global to local and move to your area of interest!
Time-series panel – Displays time-series for points or shapes defined in the image panel. Slider at the top allows for definiton of displayed range. Clickling on a data poitns diplays the respective data in the image panel.
Information panel – Get information on dataset, i.e. the entire cube, variable, or place by selecting the respective icon in the top left.
Color bar – Select colour schem and data range.
Data set controls – Select data set and variable to be displayed in the viewer.
Places controls – Select point or shape to be displayed. User shapes defined with Drawing controls will be added automatically. Country shapes are displayed in the image panel. Clicking on the small line icon on the left will generate a time-series of the country shape with mean and standard deviation and display it in the time-series panel.
Time controls – Select a date to be displayed in the calendar (left), click trough the data cube image by image or play an animation (center), or select a date to be diplayed with the slider (right).
Settings -General infrmation and some settings for the viewer including language and time interval of animation.